Output Example
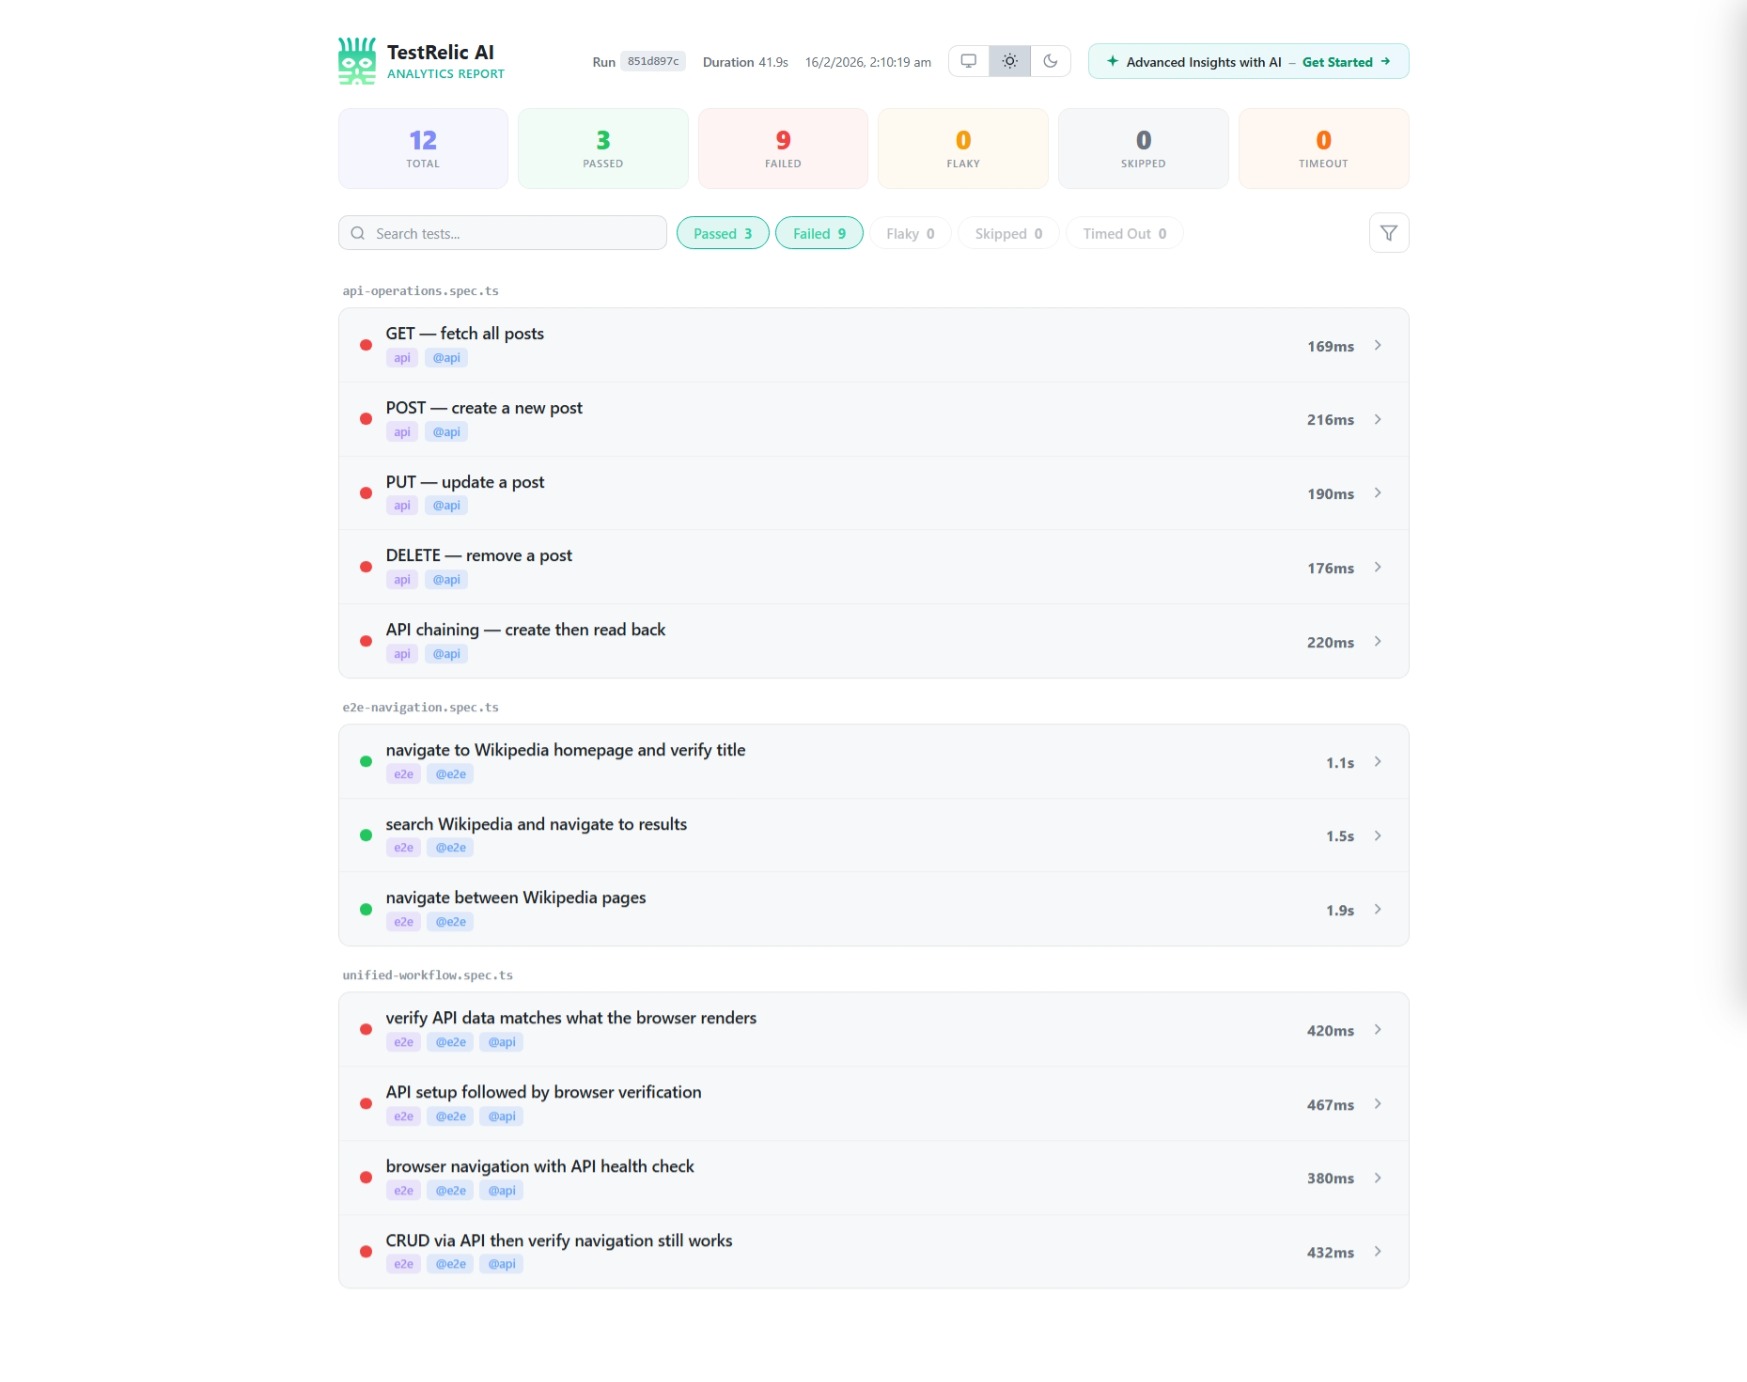
After running your tests with the TestRelic reporter, you'll get a structured JSON file with comprehensive test analytics.
What does the report contain?
The JSON report contains:
- Metadata — Schema version, test run ID, timestamps, and duration
- Summary — Test counts (passed, failed, flaky, skipped)
- CI Information — Auto-detected CI provider details
- Timeline — Chronological list of all navigations with associated tests
What does a typical report look like?
Here's what a typical TestRelic report looks like:
{
  "schemaVersion": "1.0.0",
  "testRunId": "797128f5-c86d-466c-8d6d-8ec62dfc70b6",
  "startedAt": "2026-02-07T10:41:28.759Z",
  "completedAt": "2026-02-07T10:41:36.794Z",
  "totalDuration": 8035,
  "summary": {
    "total": 6,
    "passed": 5,
    "failed": 1,
    "flaky": 0,
    "skipped": 0
  },
  "ci": {
    "provider": "github-actions",
    "buildId": "12345678",
    "commitSha": "abc123def456",
    "branch": "main"
  },
  "timeline": [
    {
      "url": "https://en.wikipedia.org/wiki/Main_Page",
      "navigationType": "goto",
      "visitedAt": "2026-02-07T10:41:29.844Z",
      "duration": 216,
      "specFile": "tests/homepage.spec.ts",
      "domContentLoadedAt": "2026-02-07T10:41:30.200Z",
      "networkStats": {
        "totalRequests": 40,
        "failedRequests": 0,
        "totalBytes": 1289736,
        "byType": {
          "xhr": 0,
          "document": 1,
          "script": 9,
          "stylesheet": 2,
          "image": 27,
          "font": 2,
          "other": 0
        }
      },
      "tests": [
        {
          "title": "homepage.spec.ts > Homepage > loads correctly",
          "status": "passed",
          "duration": 1028,
          "failure": null
        }
      ]
    }
  ]
}
What do the key fields mean?
What does each timeline entry represent?
Each entry in the timeline array represents a single page navigation with:
url— The visited URLnavigationType— How the navigation occurred (goto, link_click, back, forward, spa_route, hash_change)visitedAt— ISO timestamp when the navigation startedduration— Time in milliseconds to complete the navigationnetworkStats— Request counts and byte transfers for this navigation
What does the networkStats object contain?
The networkStats object provides detailed metrics:
totalRequests— Total number of network requestsfailedRequests— Number of failed requests (4xx, 5xx)totalBytes— Total bytes transferredbyType— Breakdown by resource type (document, script, stylesheet, image, font, xhr, other)
What does each test result inside a timeline entry contain?
Each navigation includes the tests that triggered or occurred during it:
title— Full test title including file and suitestatus— Result (passed, failed, flaky, skipped)duration— Test execution time in millisecondsfailure— Error details if the test failed (includes message, snippet, optional stack trace)
How does CI integration work?
TestRelic automatically detects your CI environment and captures:
- GitHub Actions — workflow run ID, commit SHA, branch, PR number
- GitLab CI — pipeline ID, job ID, commit SHA, branch
- Jenkins — build number, commit SHA, branch
- CircleCI — build number, workflow ID, commit SHA, branch
If not running in CI, the ci field will be null.